NFL Regular Season Sees Increases in TV Ad Spend, Ad Airings and Impressions

There's one more round of the NFL playoffs to go, and Super Bowl LIV will be here in just a few weeks. As the Big Game approaches, iSpot.tv, the always-on TV ad measurement and attribution company, put together advertising insights around the 2019 NFL regular season. (Data is from Sept. 5 through Dec. 29 and covers first airings only).
NFL games saw year-over-year increases across the board for spend, TV ad impressions and ad airings: There were 157.8 billion impressions (+11.02% from the regular 2018 season), with $4.48 billion spent (+13.75% increase) on over 32,000 ad airings (+7.08% increase). This shows the continued importance of the NFL when it comes to capturing live TV viewers. And viewers are tuned in for the ads: 97.2% of spots that aired during NFL games were watched from third quartile to completion.
Brand & Industry Highlights
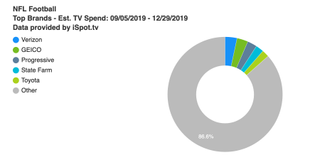
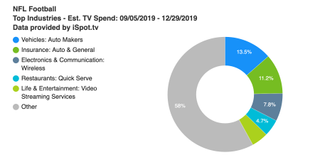
The only official NFL sponsor to make the top 10 list of brands by spend was Verizon, at No. 1. Verizon was also the top-spending brand in 2018, and it increased its estimated spend by a marginal 1.94% in 2019, up to $150.6 million. Insurance, automakers and wireless carriers made up the bulk of the top 10 list of industries by spend.
Top 10 Advertisers by Spend
- Verizon ($150.6 million)
- GEICO ($139.6 million)
- Progressive ($121.4 million)
- State Farm ($100.2 million)
- Toyota ($89.8 million)
- Hyundai ($85.6 million)
- Apple iPhone ($76.8 million)
- AT&T Wireless ($74.4 million)
- USAA ($67.5 million)
- T-Mobile ($66.3 million)

Top 5 Industries by Spend
- Vehicles: Automakers ($605.2 million)
- Insurance: Auto & General ($502.8 million)
- Electronics & Communication: Wireless ($351.0 million)
- Restaurants: Quick Serve ($211.7 million)
- Life & Entertainment: Video Streaming Services ($210.3 million)

NFL Network Drives Business Results for Wireless
Broadcasting & Cable Newsletter
The smarter way to stay on top of broadcasting and cable industry. Sign up below
At the end of the day, every marketer is ultimately concerned about ad effectiveness. That’s why iSpot recently introduced the iSpot Lift Rating, which measures the causal impact of TV advertising on key performance indicators (KPIs); or, put simply, it reflects new business driven by TV ad placements.
Notably, wireless carriers received above-average lift in Q4 on NFL Network - 34.46%, vs. the average of 32.44% across all categories and networks measured. (The KPI measured: consumer visits to wireless carrier websites where consumers, for instance, research and compare plans or technology.)
Attention Insights
While spend and impressions are important, measuring viewer attention to ad airings is also a big piece of the puzzle. iSpot has attention analytics that measure the propensity for viewers to interrupt ad play during a commercial vs. the average, called the iSpot Attention Index*.
Seven of the top 10 brands with the highest Attention Indices (with a minimum estimated spend of $15 million) were quick serve or casual dining restaurants. Burger King led, with an estimated spend of $46 million, and on average had ads that were 44% less likely to be interrupted than the average ad during NFL games. The other restaurants were Buffalo Wild Wings, Taco Bell, KFC, Subway, Pizza Hut and Wendy's. Sports-subscription app DAZN, NFL Shop and Target were three other brands with strong Attention Indices.
Looking specifically at individual spots with strong attention (minimum spend of $10 million), State Farm and Visa both had two spots in the top 10. Also notable is the Capital One Spark Cash card spot "Farmgirl Flowers," which had the second-highest spend out of any single ad during the season ($30.6 million, just behind a Google Pixel 4 spot that had $31.3 million), and was seventh for impressions (783.6 million). It received an Attention Index of 128 (28% fewer interruptions).
*iSpot Attention Index - Represents the Attention of a specific creative or program placement vs the average in its respective industry. The average is represented by a score of 100, and the total index range is from 0 through 200. For example, an attention index of 125 means that there are 25% fewer interrupted ad plays compared to the average.
